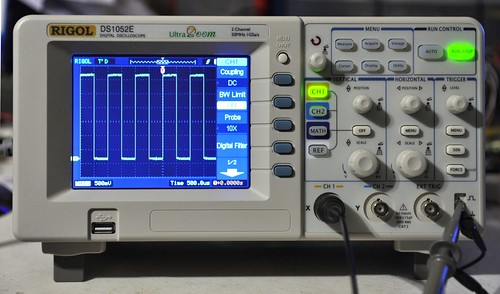
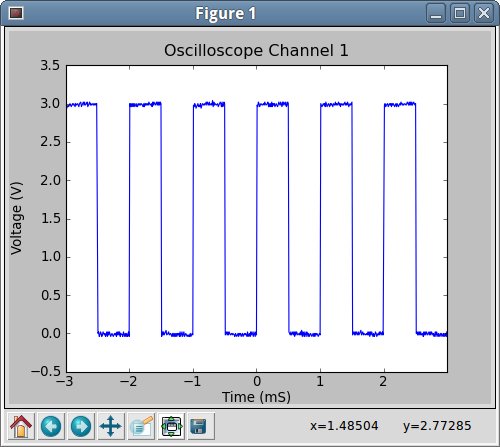
After many frustrated nights trying to debug electronics projects blindly (the analog scope is wayyyy too much work to pull off the shelf and use), I decided it was time to spring for a digital storage oscilloscope. Since I had read many good things about them, I chose the Rigol DS1052E, which is a two channel 50 MHz scope that can be easily modded to work at 100 MHz. The scope is way smaller and lighter than I expected, and has a nice set of buttons that give it the feel of a quality instrument. It works perfectly well as a standalone device, however since it has a USB slave port that implements the usbtmc interface, it turned out to be pretty easy to control using Linux. After a night of coding (most of which involved re-learning Python), I was able to grab data from the device and plot it:
This is all well and good, and should be particularly useful for my engineering pursuits, however it has me thinking about the artistic possibilities of a high-speed data acquisition device. I’m not sure exactly what I will do with it yet, but I’m thinking scope+processing or scope+pd could lead to some interesting possibilities. Any suggestions?
Source code for the current, boring use after the break.
First, a rudimentary library for accessing the usbtmc driver. After I become more familiar with what I want from the device, I may turn this into an actual interface- for now, it just exposes the devices programming interface. Name it instrument.py:
import os class usbtmc: """Simple implementation of a USBTMC device driver, in the style of visa.h""" def __init__(self, device): self.device = device self.FILE = os.open(device, os.O_RDWR) # TODO: Test that the file opened def write(self, command): os.write(self.FILE, command); def read(self, length = 4000): return os.read(self.FILE, length) def getName(self): self.write("*IDN?") return self.read(300) def sendReset(self): self.write("*RST") class RigolScope: """Class to control a Rigol DS1000 series oscilloscope""" def __init__(self, device): self.meas = usbtmc(device) self.name = self.meas.getName() print self.name def write(self, command): """Send an arbitrary command directly to the scope""" self.meas.write(command) def read(self, command): """Read an arbitrary amount of data directly from the scope""" return self.meas.read(command) def reset(self): """Reset the instrument""" self.meas.sendReset() |
And here is an example program that uses the library to grab the waveform from Channel 1 and graph it:
#!/usr/bin/python import numpy import matplotlib.pyplot as plot import instrument """ Example program to plot the Y-T data from Channel 1""" # Initialize our scope test = instrument.RigolScope("/dev/usbtmc0") # Stop data acquisition test.write(":STOP") # Grab the data from channel 1 test.write(":WAV:POIN:MODE NOR") test.write(":WAV:DATA? CHAN1") rawdata = test.read(9000) data = numpy.frombuffer(rawdata, 'B') # Get the voltage scale test.write(":CHAN1:SCAL?") voltscale = float(test.read(20)) # And the voltage offset test.write(":CHAN1:OFFS?") voltoffset = float(test.read(20)) # Walk through the data, and map it to actual voltages # First invert the data (ya rly) data = data * -1 + 255 # Now, we know from experimentation that the scope display range is actually # 30-229. So shift by 130 - the voltage offset in counts, then scale to # get the actual voltage. data = (data - 130.0 - voltoffset/voltscale*25) / 25 * voltscale # Get the timescale test.write(":TIM:SCAL?") timescale = float(test.read(20)) # Get the timescale offset test.write(":TIM:OFFS?") timeoffset = float(test.read(20)) # Now, generate a time axis. The scope display range is 0-600, with 300 being # time zero. time = numpy.arange(-300.0/50*timescale, 300.0/50*timescale, timescale/50.0) # If we generated too many points due to overflow, crop the length of time. if (time.size > data.size): time = time[0:600:1] # See if we should use a different time axis if (time[599] < 1e-3): time = time * 1e6 tUnit = "uS" elif (time[599] < 1): time = time * 1e3 tUnit = "mS" else: tUnit = "S" # Start data acquisition again, and put the scope back in local mode test.write(":RUN") test.write(":KEY:FORC") # Plot the data plot.plot(time, data) plot.title("Oscilloscope Channel 1") plot.ylabel("Voltage (V)") plot.xlabel("Time (" + tUnit + ")") plot.xlim(time[0], time[599]) plot.show() |
Pingback: Hotsolder » Blog Archive » Rigol DS1052E or DS1102E Linux Software (link)
Nice work. I linked to this post on my site which has a lot of stuff about these scopes. You might mention that you need matplotlib for this to work (I’m a C guy, not a Python guy ;-)). Easy enough to install with the package manager under Kubuntu, though, so no sweat.
Oh. And in my case, I had to set my permissions on /dev/usbtmc0, but that’s easy. Probably ought to go fix up udev to set the 666 permissions by default, but for the moment I’m too lazy
Now what would be interesting is to marry this to gnuplot. Have a look at: http://www.hotsolder.com/2010/04/analog-chart-recorder-in-shell-script.html
Maybe that’s my weekend project if you don’t beat me to it!
Thanks for the post.
Thanks! Good point about matplotlib- I’m a casual Python user, and can’t keep track of which libraries I’ve pull edfrom a package manager. I’m actually still considering switching the whole thing over to C, so that I have a better chance of using it with other environments such as the aforementioned Processing.
For udev, I added a new rules file (called 40-usbtmc-permissions.rules) to /etc/udev/rules.d, containing this line:
ATTRS{idVendor}==”1ab1″, ATTRS{idProduct}==”0588″, MODE=”0660″, GROUP=”usbtmc”
Of course, I also had to create the group usbtmc, and add myself to it. Perhaps I’ll write better instructions for that :-).
Go for the gnuplot integration- I actually wrote the example using gnuplot first, but then switched it to matplotlib since the interface was nicer from Python. Feel free to write a commandline aware client for the driver :-D.
If you want to work on the project, you can grab the latest version here: http://github.com/cibomahto/pyusbtmc
A better udev rule is:
SUBSYSTEMS==”usb”, DRIVERS=”usbtmc”, MODE=”0660″, GROUP=”usbtmc”
This should catch anything using the usbtmc driver, not just one specific scope.
This causes my DS1052E to lock up, am I doing something wrong?
@elliot Probably not, the scopes seem pretty unstable- what version of the firmware do you have running? It works fine for me using 00.02.02 SP2, but it wouldn’t work for me with the newest firmware (2.04?)
I used the code from the git repo.
When I ran it, it seems that ‘data’ is 10 items larger than ‘time’,
It seems the first 10 entires in the data list might not be proper data,
since they7 don’t seem to change; Could these possibly be something
else? ranges perhaps?
Oh, that is totally possible. I got frustrated because the whole thing was pretty fragile (sending an improper command could crash the scope, etc), and haven’t really played with it much since- I’d be interested to know if you make any progress though, since I might need to make some automated test rigs that use them in the near future.
I just had the same issue with the 10 extra data points and I have started to work on fixing it. I added an offset to the numpy.frombuffer() command. Check out my fork at github. I just started on this today and I’m not quite sure where it will take me.
@mahto: This is a great start, thanks for your work setting this up.
@Mike Thanks! Good luck getting it set up- I just thought of a new project to use the code for (a live scope trace with a little character that runs and jumps across the screen as new data comes in), so I might be motivated to get back into this as well
Thank you for your script. It got me started. I have a question though. Have you got this scope to capture in RAW mode? I can’t get more than 600 datapoints out of it and I’m using the latest 2.04 firmware. In the manual it says you could potentially capture 5k points. I tried:
:WAV:POIN:MODE RAW
:ACQ:MEMD LONG
I haven’t played with it in a while, however I consistently crashed the scope when attempting to grab long data captures from it. My guess is that it is buggy firmware :-(. If you find a fix, let me know.
After reading this: , I changed this:
test.write(":WAV:POIN:MODE NOR")
test.write(":WAV:DATA? CHAN1")
rawdata = test.read(9000)
data = numpy.frombuffer(rawdata, 'B')
to this :
test.write(":WAV:POIN:MODE RAW")

test.write(":ACQ:MEMD LONG")
test.write(":WAV:DATA? CHAN1")
rawdata = []
for i in xrange(100):
rawdata += test.read(2000)
rawdata = ''.join(rawdata)
data = numpy.frombuffer(rawdata, 'B')
“data” is now a list of samples with a sample_interval of 10ns regardless of the horizontal scale. With len(data) = 200k, I have a bit more than a period of the probe testing signal. This seems strange since the expected behavior, according to the programming manual, is to have 16384 points sampled in function of the horizontal scale.
Hey this was great. Thanks for publishing your code. I used your first class to work with a Tektronix 2024C scope with no problems. It only took me a few hours searching to find you
Great work!
Sweet, glad it worked for you!
line 41 of realtimechart.py
data = (data – 130.0 – voltoffset/voltscale*25) / 25 * voltscale + voltoffset
I also had to
plot.plot(t1[0:600], d1[0:600])
plot.plot(t2[0:600], d2[0:600])
Which gives me a slightly bogus plot.
Many thanks for posting this.
Pingback: Spiking Circuits » Automatic analog measurements using a Rigol oscilloscope » Spiking Circuits
My thanks toeveryone for the all information.
I’m working with a DS1102E(fw v00.02.06), and am still trying to figure out how determine how much data will be coming back from a :WAV command.
Also, coding in C, it appears that a read() requesting more than 2148 bytes (0×0864) , at least in NORM mode, will cause the Rigolto lock up completely, leaving oddly repeating bit patterns on the screen. Cycling power clears the problem ( but a RESET button would be really nice. )
Given this restriction, can anyone suggest how to retreive the 1M data points supposedly available in RAW mode?
( Can anyone suggest why 2148 is a “magic” number in this context? Or am I the only one who is seeing this limitation? )
I’ve not actually looked at again myself, so unfortunately I don’t know!
One issue I am having talking with my Rigol is one of pacing. You need to wait for a command to finish before you send the next. With other equipment there is often a command you can send that will only return when the scope is ready to accept a ‘real’ command. Such a command is not documented in the programmer’s guide for my D1102E. Has anyone found a workaround?
Hi,
for all those who are having problems with the scope hanging while reading more data: There is a series of patches waiting in linux-next (that is Kernel 3.11) which will address the issues:
https://git.kernel.org/cgit/linux/kernel/git/next/linux-next.git/log/drivers/usb/class/usbtmc.c
I have not yet tested them myself but my hopes are high ;-D
I am trying to interface to the Rigol DS 1102E Oscilloscope under OSX 10.9 using these routines but I get the error:
OSError: [Errno 2] No such file or directory: ‘/dev/usbtmc0′
As I understand it correctly, instrument.py should function as the USB driver but if I do a:
ls /dev/tty.*
the new USB port does not appear.
Any suggestions would be appreciated.
Thanks,
Mike Alport
The script in the post here uses Linux’s built-in USBTMC driver. I don’t think Mac OS has an equivalent driver. I have a Python USBTMC driver on GitHub that does an end run around the built-in driver by using PyUSB. It works on Linux and on Windows, but it has not yet been tested on Mac OS. If you want to give it a shot, here is the link:
https://github.com/alexforencich/python-usbtmc
I am running Linux Mint 16 (64bit) and I would like to know how to run this Python program that has ben written. I do know that Python has been installed in Mint. I am no programmer and need some help using this program.
Thank you for any reply
Gordy
Pingback: Rigol DS1052E (50MHz Digitales Speicher-Oszilloskop, 2 Kanäle, USB Storage Access) | Linux Hardware Guide
Pingback: My Raspberry Pi talks to my Oscilloscope | We Saw a Chicken …
Pingback: Rigol DS1052E (50MHz Digital Oscilloscope, 2 Channels, USB Storage Access) | Linux Hardware Guide.com
I managed to get deep memory (a million samples) to work. It seems to be necessary to use the “single” trigger sweep mode. Code is at https://github.com/dstahlke/rigol_long_mem
You can listen to AM radio with your scope, by writing a GNURadio plugin.
Hi,
thank you for great post, nevertheless I am experiencing problem while running it.
could you please help me with solving this issue? Thank you very much.
here is output:
<blockquote cite="Rigol Technologies,DS1152E,DS1ET154823591,00.04.01.00.02
Traceback (most recent call last):
File "./rigol.py", line 81, in
plot.plot(time, data)
File “/usr/lib/pymodules/python2.7/matplotlib/pyplot.py”, line 2467, in plot
ret = ax.plot(*args, **kwargs)
File “/usr/lib/pymodules/python2.7/matplotlib/axes.py”, line 3893, in plot
for line in self._get_lines(*args, **kwargs):
File “/usr/lib/pymodules/python2.7/matplotlib/axes.py”, line 322, in _grab_next_args
for seg in self._plot_args(remaining, kwargs):
File “/usr/lib/pymodules/python2.7/matplotlib/axes.py”, line 300, in _plot_args
x, y = self._xy_from_xy(x, y)
File “/usr/lib/pymodules/python2.7/matplotlib/axes.py”, line 240, in _xy_from_xy
raise ValueError(“x and y must have same first dimension”)
ValueError: x and y must have same first dimension
“>
Python version 2.7.3
Thank you
Ydenda
Solved, My Rigol returned 610 points instead of 600, thus plot function was complaining on unequal dimension.
Nice tutorial. Unfortunately I dont have too much experience with Python programming but I think it makes sense to translate your code into C and run it under Windows or Linux. I found this tutorial about Rigol oscilloscope remote control with NI-Visa
Pingback: Waterproofing Marine Equipment – 06 – A deeper look into the EVM | MyCave
Hi. Thank you for this article. Based on it I’ve made my Rigol DS1052 work under OSX with the latest version of usbtmc. In case someone needs it heres the code:
#!/usr/bin/python
#
# @~src: http://www.cibomahto.com/2010/04/controlling-a-rigol-oscilloscope-using-linux-and-python/
# @OSX manual: https://github.com/python-ivi/python-usbtmc/issues/13
#
import numpy
import matplotlib.pyplot as plot
import usbtmc
import usbtmc
instr = usbtmc.Instrument(0x1ab1,0x0588)
print(instr.ask("*IDN?"))
instr.write(":STOP")
instr.write(":WAV:POIN:MODE NOR")
instr.write(":WAV:DATA? CHAN1")
rawData = instr.read_raw(9000)
data = numpy.frombuffer(rawData, 'B')
voltscale = float(instr.ask(":CHAN1:SCAL?"))
voltoffset = float(instr.ask(":CHAN1:OFFS?"))
timescale = float(instr.ask(":TIM:SCAL?"))
timeoffset = float(instr.ask(":TIM:OFFS?"))
# Now, generate a time axis. The scope display range is 0-600, with 300 being
# time zero.
time = numpy.arange(-305.0/50*timescale, 305.0/50*timescale, timescale/50.0)
# If we generated too many points due to overflow, crop the length of time.
if (time.size > data.size):
time = time[0:610:1]
# See if we should use a different time axis
if (time[599] < 1e-3):
time = time * 1e6
tUnit = "uS"
elif (time[599] < 1):
time = time * 1e3
tUnit = "mS"
else:
tUnit = "S"
# Start data acquisition again, and put the scope back in local mode
instr.write(":RUN")
instr.write(":KEY:FORC")
# Plot the data
plot.plot(time, data)
plot.title("Oscilloscope Channel 1")
plot.ylabel("Voltage (V)")
plot.xlabel("Time (" + tUnit + ")")
plot.xlim(time[0], time[599])
plot.show()
This article has certainly been the source of a lot of inspiration. I’ve put together a small module for controlling the Rigol making use of the PyUSBTMC module. This lends the advantage compatibility with windows platforms through libusb-win32.
I’ve also been developing wrappers for the Hantek DDS function generators (a similarly high-performance-to-price item in that device category) to allow for computer controlled coordination between function generator and oscilloscope.
These modules are available on .
Ha… link should have said githubinstead of “.”.
I also made a quite simple tool with python to get data and screendump from the Rigol DS1054, but using Ethernet interface and free vxi11 transport from github. Tool and needed patch for vxi11 are available here: http://luhasoft.github.io/scopeio/
It is very new, just made yesterday and today, so bugs are certainlhy to be found.
I am acquiring data from rigol via USB cable in normal mode (600) data points. As far as I know RIGOL returns data displayed on screen in normal mode in response to WAV:DATA:CHAN1 command, but what I want to know where is the first sample located (on time axis) and where is the last sample located(on time axis). because I am interested in measuring phase difference of two wave forms(CH1 AND CH2). It is possible only if it sends me the data points of cannel1 and data points of channel 2 with respect to same time axis i.e first sample of CH1 is at t=0 and first sample of CH2 is also at t=0. Can you please guide me regarding this?
This works for me with a DS1052E, as far as it goes. There are a couple of issues though:
First, no matter how much data there is available, you only ever get 600 (or 610) bytes back. So you need to loop while reading data to get the complete buffer full. But there doesn’t seem to be any way to figure out how much data to expect. Does anyone know how to either request more than 600 bytes of data in one go, or determine beforehand how much data to expect?
Second, related to that, there doesn’t seem to be any way of checking whether there is data available from the scope other than try reading, wait for the 5s timeout and catch the resulting exception. Setting O_NDELAY or O_NONBLOCK on the file makes no difference. The 5s timeout makes it a bit useless for a live display. Does anyone know how to quickly determine if there is any data ready to be sent from the scope to the PC?